Connecting Devices using MQTT
Introduction
This guide will show you how to connect (WiFi) devices in the OpenDevice server to store and then use this data to perform analysis using the dashboards.
We will use the DHT22 sensor connected to the WiFi ESP8266 module to collect temperature and humidity, and send the server using the MQTT protocol.
Note, if you do not have this sensor in hand, you can continue this tutorial by simply skipping or commenting on the parts where it is used.
Prerequisites
- OpenDevice server up and running (guide)
- Arduino IDE (with required OpenDevice Libraries)
- ESP8266 module (like NodeMCU)
- DHT22/DHT11 sensor (and Adafruit's DHT22 library)
DHT22 |
NodeMCU |
|---|


Wiring
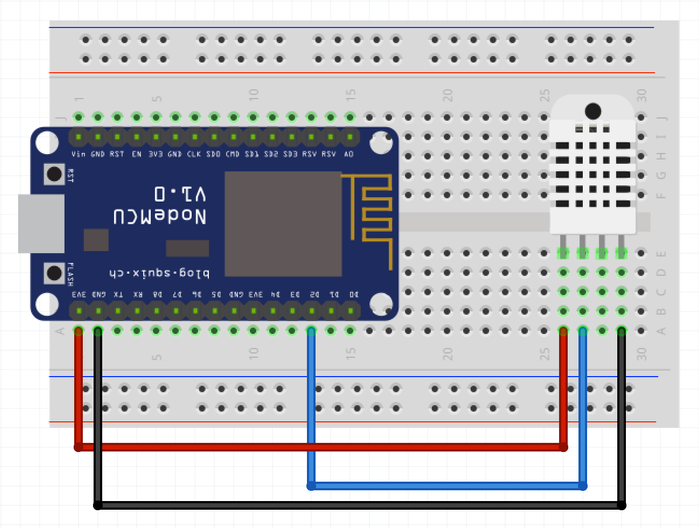
The most basic DHT humidity and temperature sensor comes in two variants with different levels of accuracy.
| DHT-11 | DHT-22 | |
|---|---|---|
| Humidity range | 20%-80%RH (±5%RH) | 0%-100%RH (±2%RH) |
| Temperature range | 0-50°C (±2°C) | -40-80°C (±0.5°C) |
| Measurement time | 1s per sample | 2s per sample |
Setup
To program the NodeMCU, we are going to use Arduino's IDE. It's the easiest way to get up and running with the DHT22.
First, you'll have to set up your machine (Device Setup Instructions). These instructions take you through installing the IDE, ESP8266 and the required libraries.
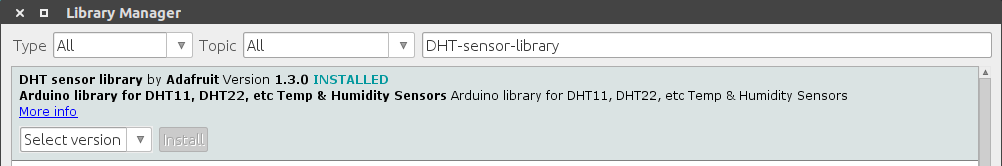
In addition to this, you'll have to install DHT sensor library to read the sensor, we are going to use Adafruit's DHT22 library, and Adafruit Unified Sensor Driver
Install Adafruit's DHT22 library using Library Manager:
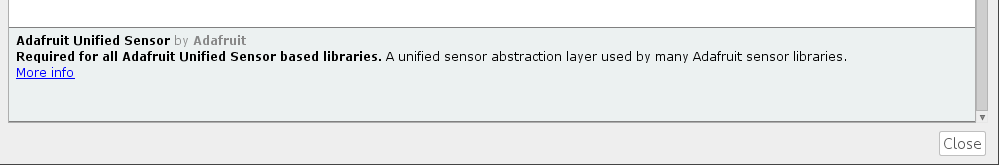
Next, install Adafruit Unified Sensor Driver
Code / Firmware
The OpenDevice for Arduino software greatly simplifies application development, managing devices and communicating with the server in a completely transparent way, so you can really focus on your project.
The library uses a set of build techniques to customize the firmware. According to the platform used and the imported libraries, OpenDevice enables certain features.
Basically when importing the libraries below, we are activating the WiFi communication and the MQTT protocol.
#include <ESP8266WiFi.h>  // Enable ESP8266 / WiFi
#include <PubSubClient.h> // enable MQTT
#include <ArduinoOTA.h>   // Remote Updates

// Sensor Libraries
#include <Adafruit_Sensor.h>
#include <DHT.h>
#include <DHT_U.h>

#include <OpenDevice.h>  // Must be included after
Next we need to configure the device name (you choose) and the api key (see this guide).
App Code (full example)
#define DHTPIN            D2         // Pin which is connected to the DHT sensor.

// Available types:  DHT11, DHT22, DHT21
DHT_Unified dht(DHTPIN, DHT11);

DHT_Unified::Temperature sTemp = dht.temperature();
DHT_Unified::Humidity sHumidity = dht.humidity();

void setup() {
  Serial.begin(115200);

  ODev.name("ODevHT-01");
  ODev.apiKey("----APIKEY-----");
  ODev.server("----SERVER IP-----");

  dht.begin(); // Initialize device.

  ODev.addSensor("HT01_Temperature", new AdafruitSensor(sTemp))
    ->setInterval(2 * (1000)); // 2sec

  ODev.addSensor("HT01_Humidity", new AdafruitSensor(sHumidity))
    ->setInterval(2 * (1000)); // 2sec

  WiFi.mode(WIFI_AP_STA);
  WiFi.begin("---- WIFI----", "---- PASS----");

  ODev.begin();
}

void loop() {
  ODev.loop();
}
Next, upload code to the board and open up your serial monitor, you should see the data:
20:08:06.529 -> DB:WiFi :: Conneted
20:08:07.523 -> DB:SoftAP :: OK
20:08:07.523 -> DB:TCPServer :: OK
20:08:07.523 -> Mode: STA+AP
20:08:07.523 -> Auto connect: 1
20:08:07.523 -> SSID (10): xxxxxxxxxxx
20:08:07.523 -> Passphrase (10): xxxxxxxxxx
20:08:07.523 -> DB:IP STA:
20:08:07.523 -> 192.168.2.113
20:08:07.523 -> DB:IP softAP:
20:08:07.523 -> 192.168.4.1
20:08:07.523 -> DB:MQTT :: BEGIN
20:08:27.640 -> DB:MQTT :: connecting...
20:08:27.673 -> DB:MQTT :: [connected]
Sending data to the cloud
You do not have to do much, just make sure you are looking at the console, if the WiFi connection and the MQTT was successfully performed.
The OpenDevice server already has a mqtt broker and an embedded database, this makes it much easier =].
Start the OpenDevice (guide), access http://localhost:8181, and verify that your devices have been registered correctly.
In the Boards page, you should see your device/module already.:
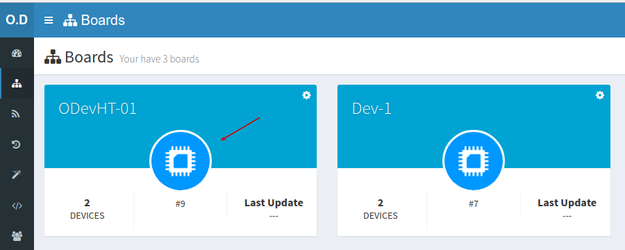
Our module has two linked devices:
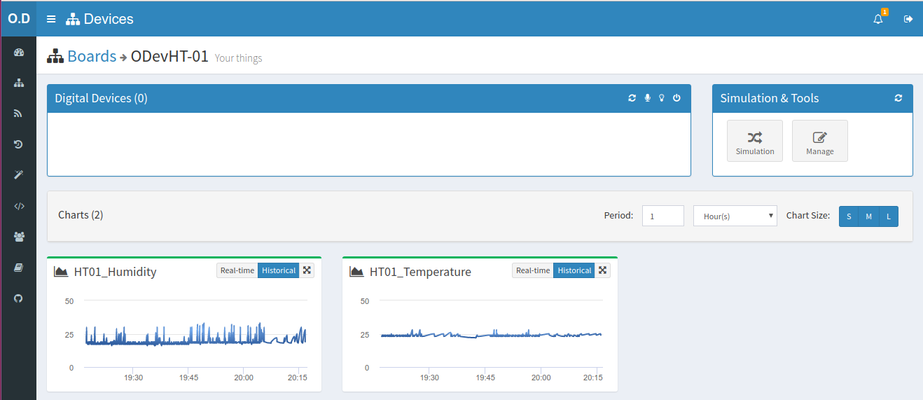
On this page we already have a series of tools and visualizations that we can analyze how the device is behaving.
But we have a better tool to do the analyzes that are the Dashboards
Create custom visualizations using Dashboards
You can create multiple dashboards in OpenDevice that let you analyze device data in both real-time and historical data. You can also apply functions to the data such as average and standard deviation.
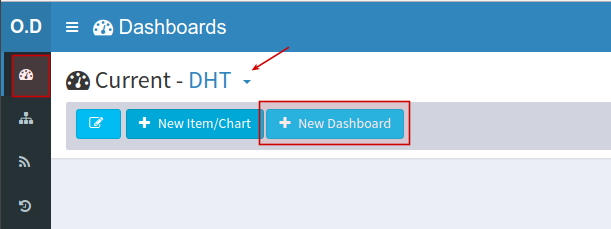
First create the dashboard
On dashboards page click in " New Dashboard ", set the name and select it in the list.
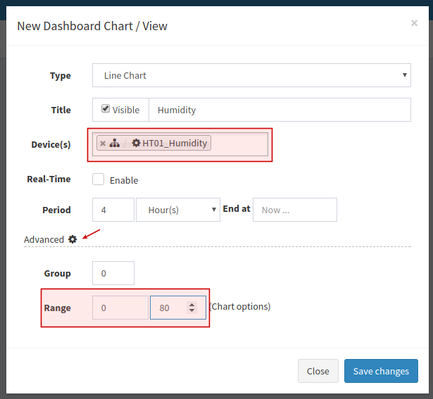
Then add Widgets
Let's create the line graph to display as temperature information in the last 4 hours.
Click and Add Item/Chart and select Line Chart
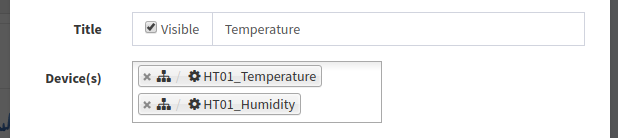
You can also add more then on device on the chart:
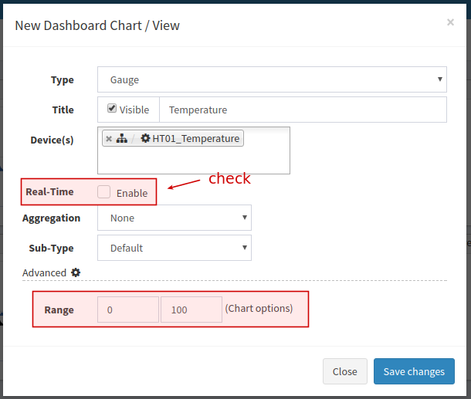
Let's now add a gauge that shows the temperature value in real time:
You have the freedom to edit and position and enlarge the graph as you wish
TIP: In the dashboard you can use shortcuts like: F2 (edit), and: CTRL + S (save). And numeric shortcuts: 1..10, to change dashboard view
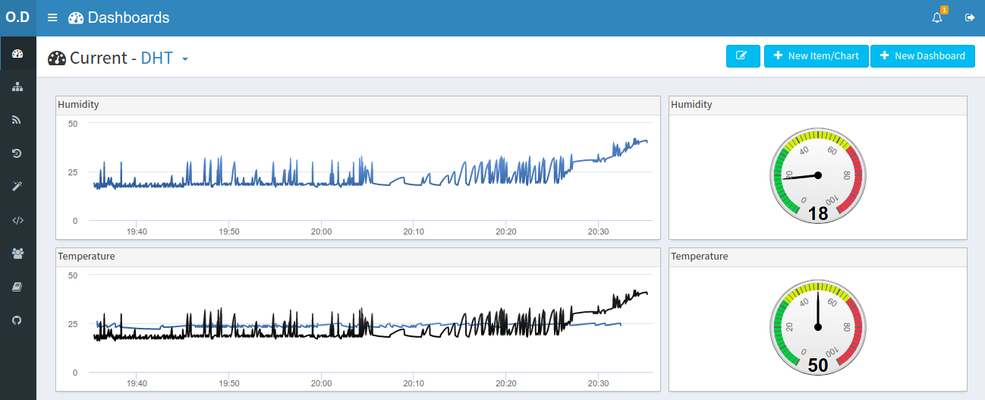
After organizing our charts, dragging and expanding, we get the result:
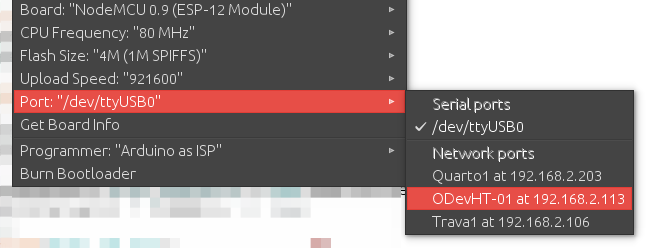
Update firmware over WiFi (OTA)
Now after the device is working and online, we can upgrade via OTA. In the Arduino IDE, the device should appear as if it were a Port:
Guide: Remote Updates (OTA)
WHAT'S NEXT?
At this point, you are collecting and visualizing data. But, what about reacting to it? The next step is to build a Rule(/wiki/spaces/DOC/pages/99352732) to send yourself a text message whenever the humidity gets too low.
Examples:
https://github.com/OpenDevice/opendevice-lib-arduino/tree/master/examples
Recommended Resources:
- ESP8266 Troubleshooting Guide
- Getting Started Guide for the ESP8266 WiFi Module
- DHT11/DHT22 Humidity and Temperature Sensor With Arduino